


Mapping it Out: Geo-Referencing Data from the Erbil Plain
Sebastian Millien, 2021 Strange/Midkiff Families Summer Stipend Recipient
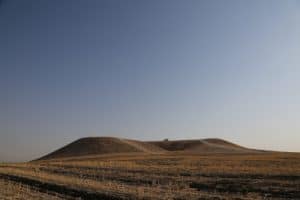
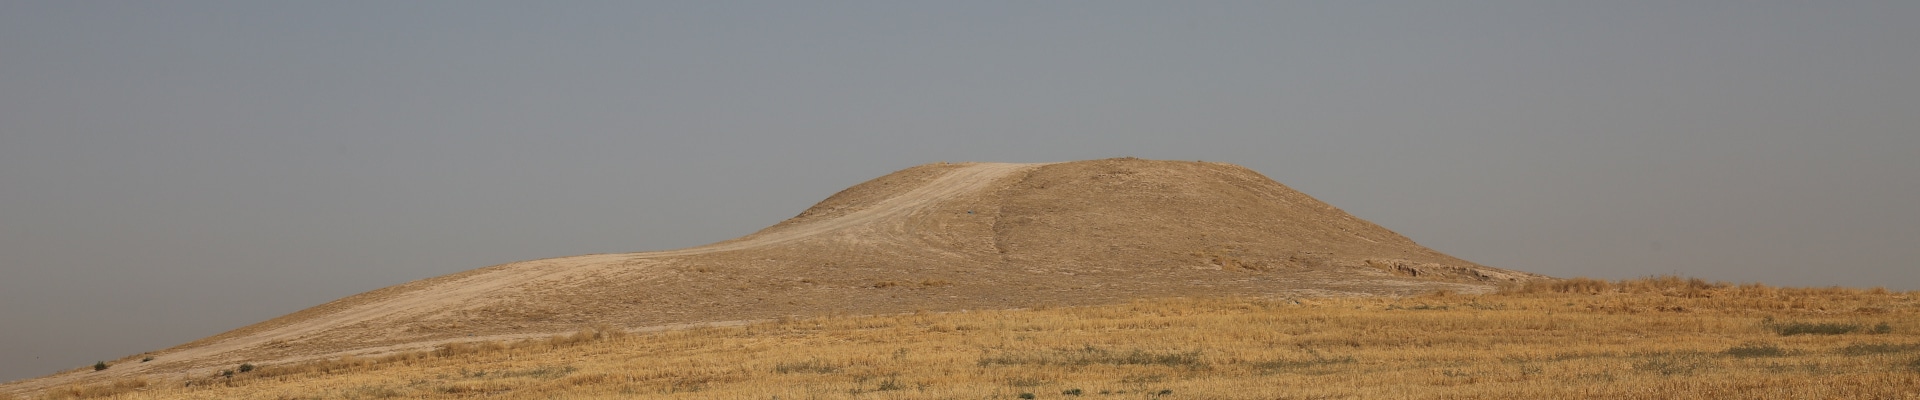
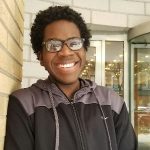
Aliawa (Site 246). Photo courtesy of the Erbil Plain Archaeological Survey.
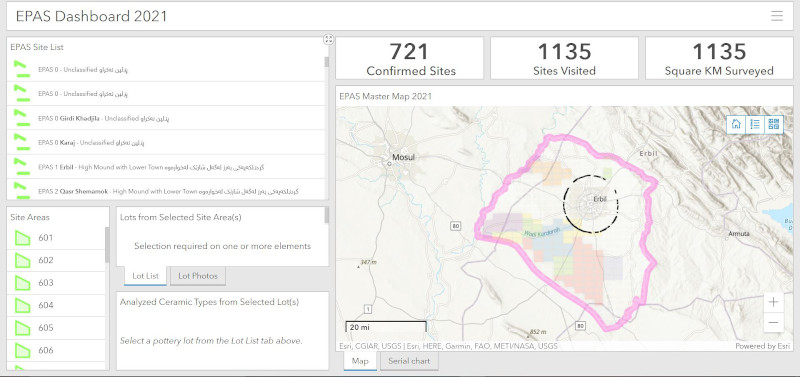
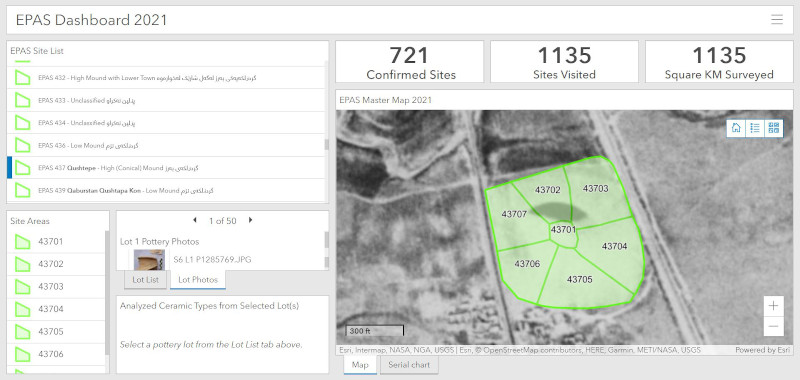
This summer, I worked with Dr. Jason Ur on the Erbil Plain Archaeological Survey Project. The project was focused on the Kurdistan region of Iraq, particularly the Erbil Plain. An archaeological survey was done on large mounds and the surrounding environment, and the landscape was captured was drone and satellite imaging. As a result of the surveys, a large amount of data has been collected thus far. These include images of different artifacts collected from the location (mainly pottery shards from the mounds) as well as drone images of the various sites and lots surveyed in the region. Dr. Ur’s goal following this large collection of data was to build an interactive and collaborative web dashboard where the drone and satellite images could be geo-referenced on a GIS map. These images would be linked to the sites they came from, as well as the photos of the pottery shards from that respective site. In other words, the objective was a massive processing of the archaeological finds to make the data more accessible to everyone involved in the project and correlate the data to physical location on the site.
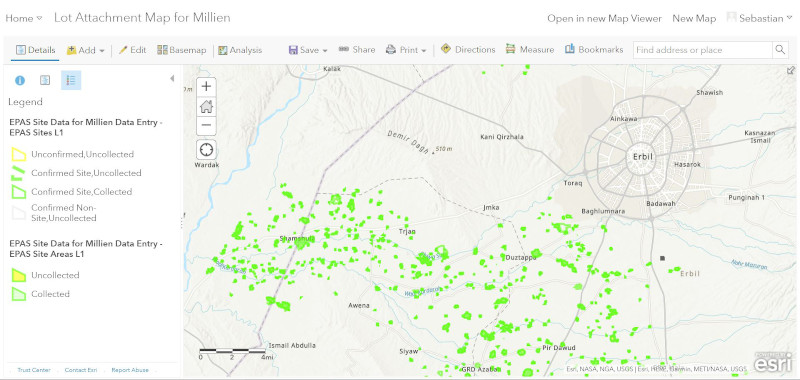
My role in the project was to categorize and label the different data so that I could then input it into the dashboard. The images of the pottery shards had to be re-named to correspond with the site and lot they were collected from. Additionally, the images of the sites from the drones needed to be matched with the locations on the GIS map. Once I had all the renamed and categorized, I then uploaded them into the lot attachment map. This data would then appear on the interactive dashboard. On the dashboard, the different sites are labeled, and selecting a particular site would make all the data correlating for that site immediately available.
 My name is Sebastian Millien, and I am currently and undergraduate at Harvard university studying Chemical and Physical Biology and Archaeology. I was born and raised in Brooklyn, but my family is from Haiti. In the future, I hope to combine biochemistry and archaeology to discover even more about the past.